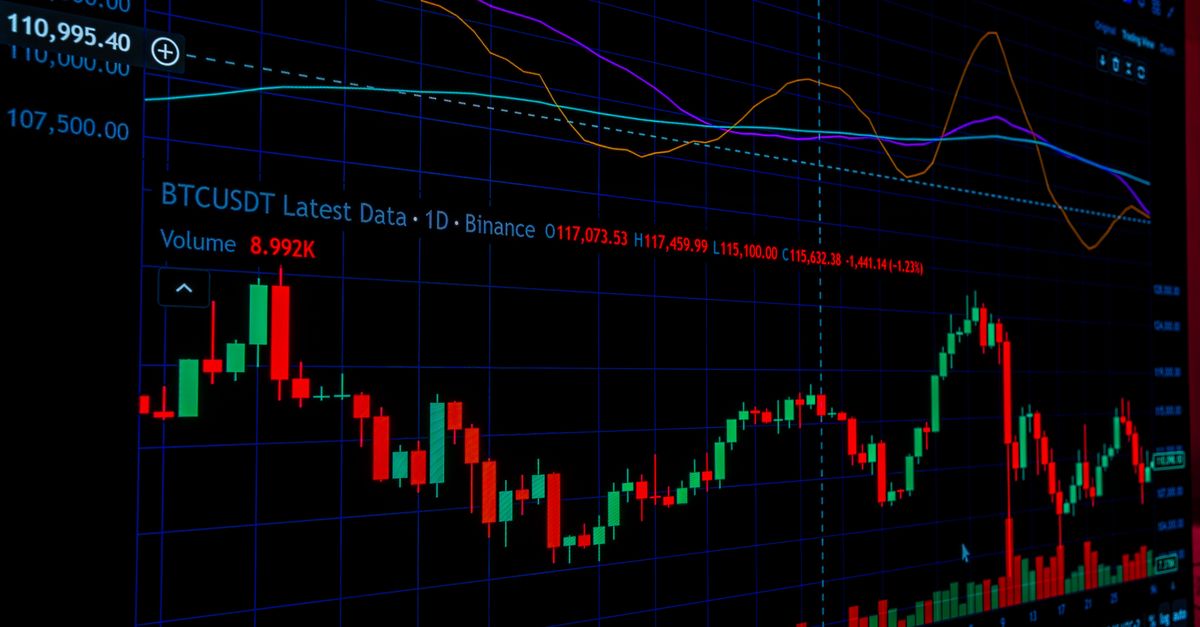
Those high-return strategies
in historical data
how long would yours last?
The smoother a return curve looks, the more it is worth asking where it comes from — from calling direction right? Or from structural sources like hedging, funding rates and grid trading? The first disappears when the market turns; the second when liquidity tightens. Now you can put your own strategy into a sentence — and the same data will answer.
Disclaimer: Trading financial instruments involves risk. This platform is educational only — nothing here is financial advice or a recommendation to buy or sell any instrument.
Tokenized stocks, covered in detail
A market that never closes, measured in minutes. We cover 80 tokenized names — individual stocks and funds issued on-chain — and we are explicit about what that data can and cannot support.
80 tokenized listings
Technology, semiconductor, energy and index names issued as tokens, each with its own listing date and therefore its own available history.
Minute bars, not daily
Listings began in 2026, so there is no meaningful daily history. Coverage runs to 60 days of 1-minute bars and 90 days of 5- and 15-minute bars.
Continuous session
These instruments trade seven days a week against a stablecoin, so overnight gaps and weekend moves are part of the data — unlike the shares they track.
Where we stand
SoloTrade is a tool, not an adviser. We do not recommend, rate or rank any instrument, we do not execute trades, and no commercial arrangement changes what our data shows. A backtest is a historical simulation: it describes what a rule would have done, not what it will do.
Minute-level backtesting and practice on this market require the Max plan.
Indicators, tools and calculators built in
From learning to validated strategy in minutes
Pick a market, set the basics
Choose the symbol you want to study, your starting capital, and how much to risk on each trade. Fees and slippage are real numbers — what you see is what the market would have charged.
Write your entry and exit rules
Two sentences are enough to start: when to get in, and when to get out. Stack conditions like building blocks — no code, and every rule reads back to you in plain language.
Replay it and read the result
Run the plan over real price history and see what actually happened — the equity curve, the drawdown, and every entry and exit marked on the chart. Judge it by the numbers, not by how convincing the idea sounds.
How these strategies held up out of sample
Run in public on the same engine we give you. Each result is one dataset split into 6 independent periods — the gap between the best and the worst is shown as-is.
Bets on trend continuation after a breakout: enters only when price breaks the 20-bar high and holds above the moving average, with a 1:3 reward-to-risk exit; choppy markets full of false breakouts bleed the account.
52 of 90 Segments Profitable; Median Segment Return +1.5%; Mean Below Buy-and-Hold
- Median period return
- 1.5%
- Deepest drawdown
- 13.2%
- Profitable periods
- 52 of 90
- Liquidated
- No
Historical data only. Not investment advice — we do not recommend, rate or rank strategies.
Bets on reversion after a liquidity sweep: enters when price crosses back above the lower Donchian band and exits on a cross below; in a sustained downtrend the sweeps keep failing.
Only 29 Profitable Out of 90 Splits, Median Segment Return -4.6%, Underperforms Buy-and-Hold
- Median period return
- -4.6%
- Deepest drawdown
- 38.3%
- Profitable periods
- 29 of 90
- Liquidated
- No
Historical data only. Not investment advice — we do not recommend, rate or rank strategies.
Bets on short-term trend continuation: enters only when an MA cross aligns with a Donchian breakout, banking quick profits in trending legs while rangebound chop bleeds capital through repeated stop-outs.
Only 28 of 90 Splits Profitable, Median −6.0%, and It Underperformed Buy-and-Hold
- Median period return
- -6.0%
- Deepest drawdown
- 32.6%
- Profitable periods
- 28 of 90
- Liquidated
- No
Historical data only. Not investment advice — we do not recommend, rate or rank strategies.
Bets the trend pullback is over: enters when price reclaims the fast MA with RSI not overheated; a shift to chop or a deeper retracement brings repeated stop-outs.
Only 50 of 90 splits profitable; median segment return +3.4% below the holding benchmark
- Median period return
- 3.4%
- Deepest drawdown
- 50.0%
- Profitable periods
- 50 of 90
- Liquidated
- No
Historical data only. Not investment advice — we do not recommend, rate or rank strategies.
Bets on triple confirmation (MA, RSI, MACD) before entering and rides trends; signals lag, so repeated crossovers bleed capital in range markets.
69/90 profitable, median +28.7% lags buy-and-hold average +101.7%
- Median period return
- 28.7%
- Deepest drawdown
- 72.7%
- Profitable periods
- 69 of 90
- Liquidated
- No
Historical data only. Not investment advice — we do not recommend, rate or rank strategies.
Bets on trend continuation after breakout: enters only on a break above the Donchian upper band; frequent false breakouts in rangebound markets cause repeated stop-outs.
90-Segment Test: Only 25 Profitable, Median Segment Return -8.5%
- Median period return
- -8.5%
- Deepest drawdown
- 32.0%
- Profitable periods
- 25 of 90
- Liquidated
- No
Historical data only. Not investment advice — we do not recommend, rate or rank strategies.
Economic news
The latest market-moving headlines across stocks, crypto, currencies and mergers — objective context, not trading advice.
Market briefing
An objective recap of today's US stock and crypto markets, built from public market data.
Learning center
Beginner guides and trading notes organized from classic trading books, taking you from concepts to practice step by step.
Everything a new trader needs
Calculators, a no-code strategy studio, daily and minute-level backtesting with out-of-sample validation, a learning center and daily market briefings — the complete loop from first lesson to a strategy you can trust.
33 trading calculators
Position size, profit/loss, stop-loss, risk-reward, expectancy, CAGR, DCA, options and more. Every calculator runs live and shows its formula — no sign-up needed.
Zero-code strategy studio
Combine entry, exit and position rules visually. See your strategy described in plain language in real time.
Risk management
Account-level risk tiers, trailing stops and max-additions caps, plus fixed, Kelly and risk-percent position sizing — commissions and slippage charged on every fill.
Plain-language backtest evaluation
Readable metrics — win rate, drawdown, Sharpe, Sortino, Calmar — plus sensitivity checks across neighbouring parameters and a confidence rating for every result.
Learning center
Beginner guides, trading notes and a full market glossary, linked to the tools you use.
Daily market briefing
Auto-generated daily summaries of the three major indexes, top movers and the economic calendar.
Training ground
Build on one slice of history — daily or minute bars — then validate on data your strategy has never seen and catch overfitting before it costs you money.
// Build your strategy
export default defineStrategy({
  name: "",
  timeframe: "",
  entry: "",
  exit: "",
  holding_days: ,
  position: ,
})Build a strategy in seconds
Combine entry, exit and position rules like building blocks. No coding, no complexity — your strategy is described in plain language instantly.
What you can actually do here
Strategy studio
Build a trading strategy from visual rule blocks — no programming required.
Backtesting engine
Run it against historical market data and read return, drawdown, Sharpe and more.
AI strategy review
A plain-language explanation of why a strategy made or lost money, not just numbers.
31 calculators
Position sizing, risk, returns and more — in the same place as the strategies.
Practice ground
Rehearse decisions on real market history without putting money at risk.
Intraday data, 7 languages
1m, 5m, 15m and 30m intervals, with the whole interface available in seven languages.
SoloTrade is new and has no customers yet, so there are no testimonials to show here. Everything listed above is a feature you can verify on the site itself.
Why traders choose SoloTrade
Simple, transparent pricing
Start free, scale as you grow. No hidden fees, no surprises.
Free
The full platform with usage limits — no card, no countdown.
Best for
Testing whether an idea survives contact with real data.
No monthly allowance — signup credits only
- All 31 calculators, no account needed
- Backtesting on daily bars, up to 2 years of history
- Training ground on daily bars
- AI strategy review, started manually
- Learning centre, glossary and market pages
- 50 credits on signup (one-off)
- No credit card required
- Intraday intervals (1m / 5m / 15m / 30m)
- History deeper than 2 years
Pro
Deeper history, and your first intraday intervals.
Best for
Swing and intraday strategies on 15- and 30-minute bars, over a decade of context.
Includes 360 credits/month · about 72 runs with review
- Everything in Free
- Daily history up to 10 years
- Intraday backtesting on 15- and 30-minute bars
- Training ground on 15- and 30-minute bars
- 360 credits every month
- AI strategy review runs automatically after each backtest
- 1-minute and 5-minute intervals
Max
Every interval we support, and the longest intraday windows.
Best for
High-frequency rules that only make sense on 1- to 5-minute bars.
Includes 1000 credits/month · about 200 runs with review
- Everything in Pro
- 1000 credits every month
- 5-minute bars with up to 180 days of intraday history
- 1-minute bars with up to 60 days of intraday history
- The longest intraday windows we offer (up to 1095 days on 30-minute bars)
Frequently asked questions
Yes. The free plan includes every calculator, the strategy studio, backtesting, the training ground, the learning center and the market pages — nothing is locked behind payment. What limits the free plan is credits: you start with 50 on signup and each engine run costs 3 of them. Paid plans add a monthly credit allowance and unlock longer history and intraday bars.
No. The strategy studio is zero-code: you combine entry, exit and position rules as visual building blocks, and the platform describes your strategy in plain language as you go. Programming knowledge is not required.
Backtests run against cached historical price data for a set of supported stocks, ETFs and crypto pairs, by default covering the last two years. Results are computed locally so they are fast, repeatable, and do not depend on live market conditions.
Each backtest reports standard metrics — total return, max drawdown, win rate, profit factor, Sharpe, Sortino and Calmar — alongside a plain-language summary of your strategy's behavior, such as whether it tends to perform better in trending or sideways markets.
The learning center offers beginner guides, trading notes and a glossary that are linked to the tools themselves. The idea is a loop: read about a concept, apply it in a calculator, then build and backtest a strategy that uses it.
The market page shows daily summaries for US stocks and crypto, plus an economic calendar of earnings, dividends and splits. These are generated from public market data and are provided for context and education only — not as trading signals.
Your saved strategies, backtests and plans are stored in your account and are not shared publicly. Nothing you create is visible to other users — there is no public profile and no shared strategy library.
No. SoloTrade provides educational tools, backtesting features and market information for informational purposes only. Nothing on the site constitutes financial, investment or trading advice. Trading involves substantial risk of loss, and past or simulated performance does not guarantee future results.
Ready to validate your first strategy?
Put someone else's strategy — or your own idea — through the real data. Free to start, no card required.
No credit card required · 50 free credits on signup