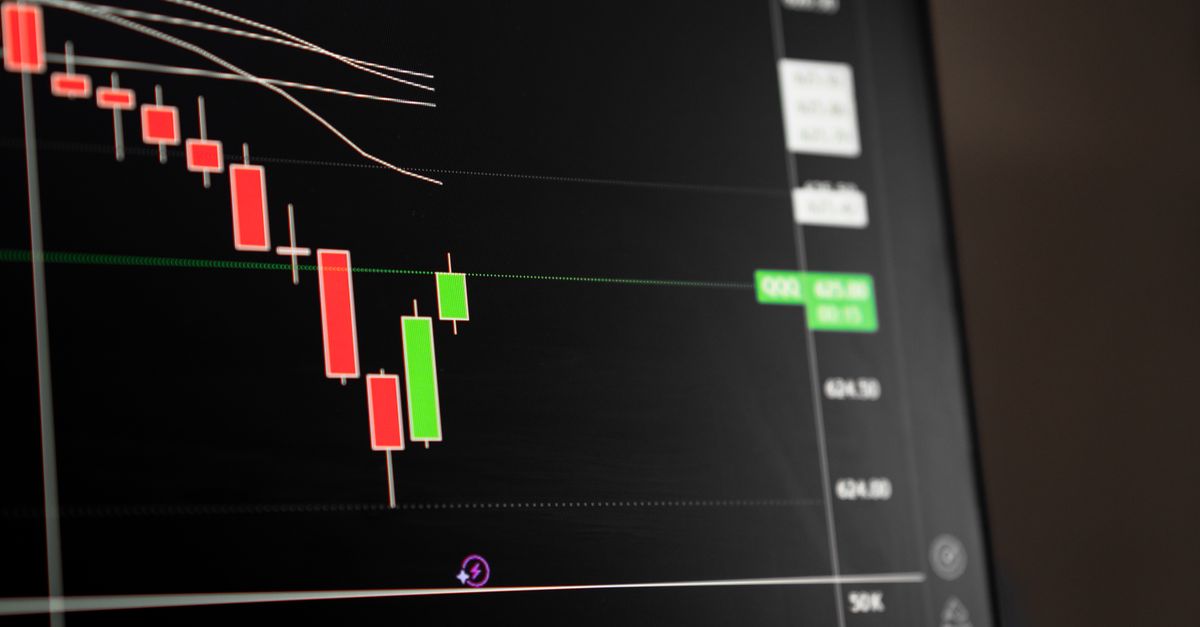
What the Edge Ratio Measures
An entry signal is not an isolated event. Everything that happens to price after the signal fires, including the movement that helps a position and the movement that hurts it, becomes part of the signal's record. The edge ratio is a quantitative tool for summarizing that record and for judging whether an entry rule carries a directional advantage. The intuitive version of the idea is simple. After a signal, price travels some distance in the favorable direction and some distance in the unfavorable direction. If, on average across many signals, the favorable travel is larger than the unfavorable travel, the signal has a positive edge. If the entry rule is completely random, for example a coin flip that decides whether to go long or short, then over a large sample the favorable and unfavorable excursions should be roughly equal, and the edge should sit close to zero. The edge ratio turns this comparison into a single number. It is the ratio of the average favorable excursion to the average adverse excursion after adjustment for market volatility. A value above 1 means favorable travel has dominated; a value near 1 means the signal has behaved much like a random entry; a value below 1 means adverse travel has dominated. It is important to be precise about what the measure is and is not. The edge ratio does not describe the outcome of any individual trade, and it does not state whether a position will eventually be closed at a profit. It describes the statistical tendency of price movement after a signal, aggregated over a sample of signals. That distinction is what makes it useful in systematic design: it evaluates an entry in terms of probability and distribution rather than in terms of a single outcome.
Favorable and Adverse Excursion: The Raw Building Blocks
A trade begins at an entry price and ends at an exit price, but between those two moments price usually travels through a range. The most extreme point reached against the position, measured as a distance from the entry price, is commonly called the maximum adverse excursion. The most extreme point reached in favor of the position is the maximum favorable excursion. For a long position, rising prices produce favorable excursion and falling prices produce adverse excursion. For a short position, the mapping is reversed: falling prices are favorable and rising prices are adverse. In edge ratio studies, these two quantities are usually recorded over a fixed window after entry rather than over the full life of a trade, so that many signals can be compared on equal footing. Two properties matter. First, excursions are distances, not returns; they are expressed in price units before any normalization. Second, an excursion is a record of what price actually did, not a forecast. A large adverse excursion does not by itself mean a signal is flawed. It means that in that particular instance price moved a certain distance against the position before doing anything else. Recording adverse and favorable excursions is a standard exercise in trade analysis. Distributions of adverse excursion show where stop levels would have been reached, and distributions of favorable excursion show how much favorable travel was available before the position was closed. The edge ratio takes the averages of these two distributions and compares them, but the distributions themselves remain the raw material. Their shape, including skew, tail behavior and sample size, still matters for interpretation. A ratio calculated from a handful of signals and a ratio calculated from thousands of signals are not equally informative, even when the arithmetic looks the same.