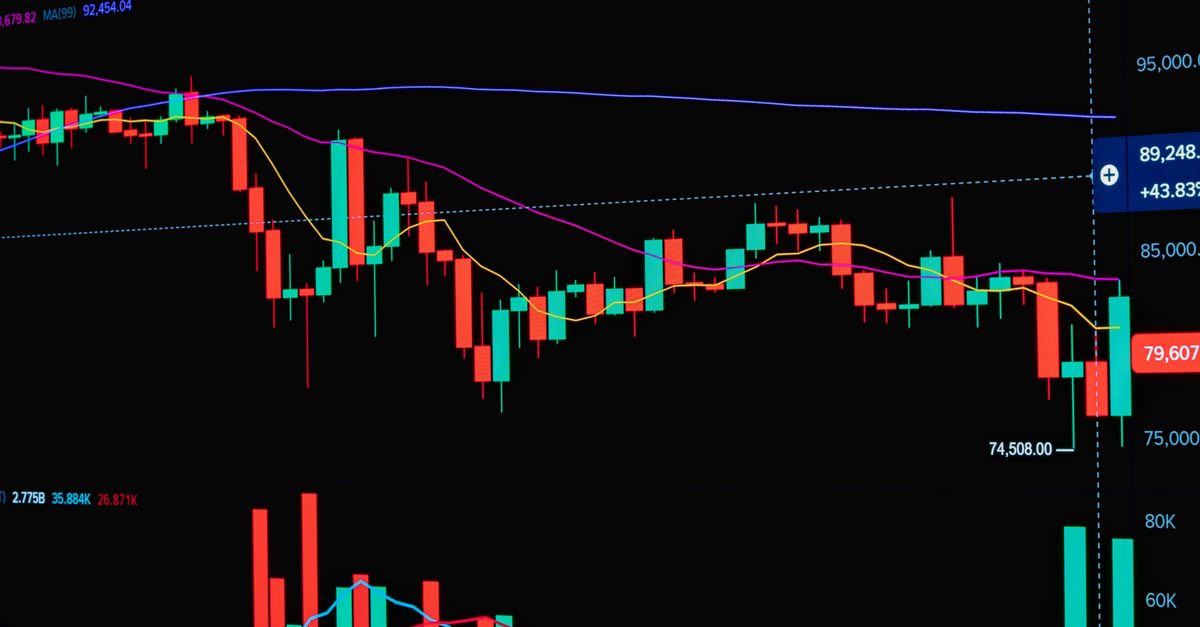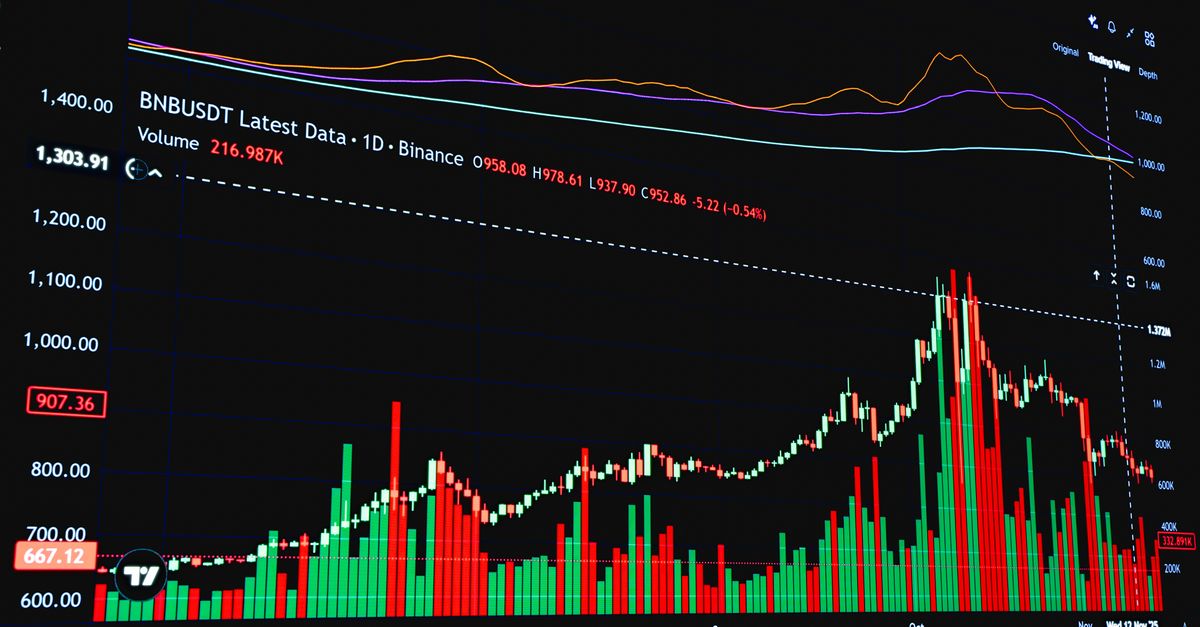
Why the Search for Market Order Is So Attractive
The belief that everything has order is extremely popular. People want to understand how markets work, and for many of them, finding some basic structure in market behavior is highly appealing. The logic is straightforward: if you can identify the fundamental structure of the market, you should be able to predict its movements. In many cases, these theories become even more precise, because they attempt to forecast the turning points of market moves. That naturally appeals to the widespread psychological desire to be right and to feel in control of the market. Traders who hold this view often hope to catch tops and bottoms, rather than simply participate in trends. There is also a commercial dimension: order-based theories are a valuable selling point to the public. A theory that claims to reveal hidden market structure can attract a large audience, especially when it offers specific dates or price levels for reversals. Several well-known frameworks fall into this broad category, including Gann theory, Elliott Wave Theory, and astrological theories of markets. This article does not endorse any of them. Instead, it treats them as belief systems that attempt to answer the same question: is there a discoverable order behind price movement? To explore that question, it helps to separate the main strands of thought. One strand looks at human behavior as cyclical. Another looks at material systems in the universe. A third looks for a mysterious mathematical order. Each strand offers a different explanation for why markets might turn at certain points, and each has its own strengths, weaknesses, and common misuses.
Human Behavior as a Cyclical Wave: Elliott Wave Theory
The first strand of market-order thinking holds that markets are a product of human behavior, and that human motivation can be summarized by a specific structure. The most famous theory in this group is Elliott Wave Theory. It proposes that fear and greed move in recognizable wave patterns. In its basic form, the theory says that a market move consists of five waves in the direction of the main trend, followed by three corrective waves. For example, a large upward trend is made up of five rising waves, with waves two and four moving in the opposite direction, meaning downward. After those five waves, three downward waves follow, with the middle wave moving in the opposite direction, meaning upward. Each wave is said to have its own characteristics. In the five-wave sequence, the third large wave is often described as the most tradeable. The theory becomes very complex because waves contain smaller waves. In other words, Elliott Wave patterns exist at many different degrees. The first wave of a large market move might itself be a complete sequence of five waves plus three corrective waves. Elliott himself believed there were waves of many degrees, from enormous supercycles down to extremely small fluctuations. When making market decisions, certain rules can help in applying the theory. Because waves can extend and patterns can change, the rules also change. The full set of rules and their variations is beyond the scope of this discussion, but they are intended to help identify tradeable turning points. In practice, the task is to determine which wave series produced any given turning point. That is a major challenge, because the same price chart can often be labeled in more than one valid way, and the labeling may only become clear after the fact. This complexity is both the theory's strength and its weakness. It offers a rich language for describing market swings, but it can also become so flexible that almost any outcome can be explained after the fact.