Identifying Range-Bound Markets and Buying Opportunities
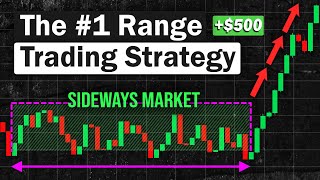
A range-bound market is a market where the price moves sideways between a relatively consistent upper boundary (resistance) and lower boundary (support). Unlike trending markets, which make higher highs and higher lows or lower highs and lower lows, a range-bound market oscillates around a mean. To discover such a market, traders often look for at least two touches of a resistance level and two touches of a support level. The touches do not need to be exact; they can form a zone. Volume patterns can also help: volume often decreases as the price approaches the middle of the range and may spike at the boundaries. Oscillators such as the Relative Strength Index (RSI) or Stochastic can show overbought conditions near resistance and oversold near support, but these signals are only useful if the market is indeed ranging. Buying in such a market typically involves entering near the lower boundary, ideally after some confirmation that the support is holding. Confirmation might be a bullish candlestick pattern (e.g., hammer, engulfing), a positive divergence on an oscillator, or a failure to break below support. The idea is to buy low and sell high within the established range. However, buying at support is not without risk. The range may break downward, turning the support into resistance. Therefore, a stop-loss is usually placed just below the support zone. The potential profit is the distance to the upper boundary, while the risk is the distance to the stop. This risk-reward ratio must be evaluated before entering. It is also important to consider the timeframe: a range on a daily chart may not be visible on a weekly chart. Traders often use multiple timeframes to confirm the range and refine entries.
Defining the Range: Fixed vs. Dynamic Boundaries
Once a potential range is identified, the next question is how to define its boundaries precisely. The original question asks whether to use fixed or static swings. Fixed boundaries are horizontal lines drawn at specific price levels where the market has reversed multiple times. These levels are static because they do not change unless the market breaks them. They are simple to use and easy to communicate. However, fixed levels can become outdated as market conditions change. For example, a range that held for weeks may break due to a news event, and the old support becomes resistance. Dynamic boundaries, on the other hand, adjust with price action. They can be based on moving averages (e.g., a 20-period simple moving average acting as a mean that price oscillates around), Bollinger Bands, or volatility measures like Average True Range (ATR). A dynamic range might use a moving average plus/minus a multiple of ATR to define upper and lower bands. Swing highs and lows can also be used, but they are not fixed; they shift as new swings form. The choice between fixed and dynamic depends on the trader's style and the market's behavior. Fixed levels work well in stable, low-volatility environments, while dynamic bands adapt better to changing volatility. Some traders use a hybrid: they mark major horizontal levels but also use a dynamic filter to avoid trading when the range is too narrow. The key is consistency: whatever method is chosen, it should be applied systematically. It is also important to define the range on a closing basis or using intraday highs/lows. Many false breakouts occur when using intraday extremes, so some traders prefer to wait for a daily close outside the boundary to confirm a breakout. Ultimately, there is no single correct way to define a range; the method must align with the overall trading plan and risk tolerance.