The Role of Confirmation in Trend Following
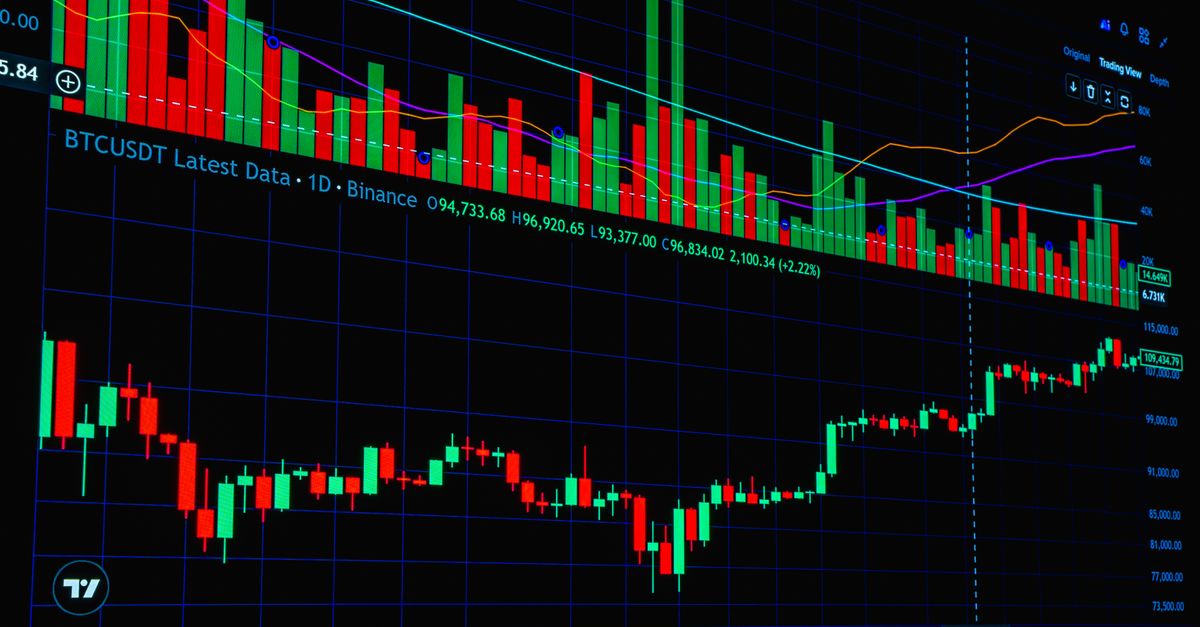
Trend following is built on the idea that prices sometimes move in persistent directions, and that participating in those moves can be more profitable than trying to predict reversals. However, the transition from a ranging market to a trending market is rarely obvious in real time. Confirmation provides a set of objective criteria that help traders distinguish between random noise and a genuine shift in supply and demand. Without confirmation, a trader risks entering on every minor fluctuation, which often leads to whipsaws, repeated small losses, and emotional decision-making. With confirmation, the trader accepts a later entry in exchange for a higher probability that the move will continue. This trade-off is central to most trend-following approaches: giving up some of the initial move in return for evidence that the trend is real. Confirmation is not prediction. It does not claim to know the future; it simply responds to what price has already done. Common confirmation tools include trendline breaks, moving average crossovers, momentum indicators such as MACD and RSI, breakout of support or resistance, consecutive price bars in one direction, and volume patterns. Each tool has strengths and weaknesses, and many traders combine several to filter signals. The key is to define rules in advance, so that entries and exits are based on observable market behavior rather than subjective opinion. This section sets the foundation: confirmation is a risk-management mechanism, not a crystal ball.
Confirming Trend Initiation: Trendline Breaks and Moving Average Crossovers
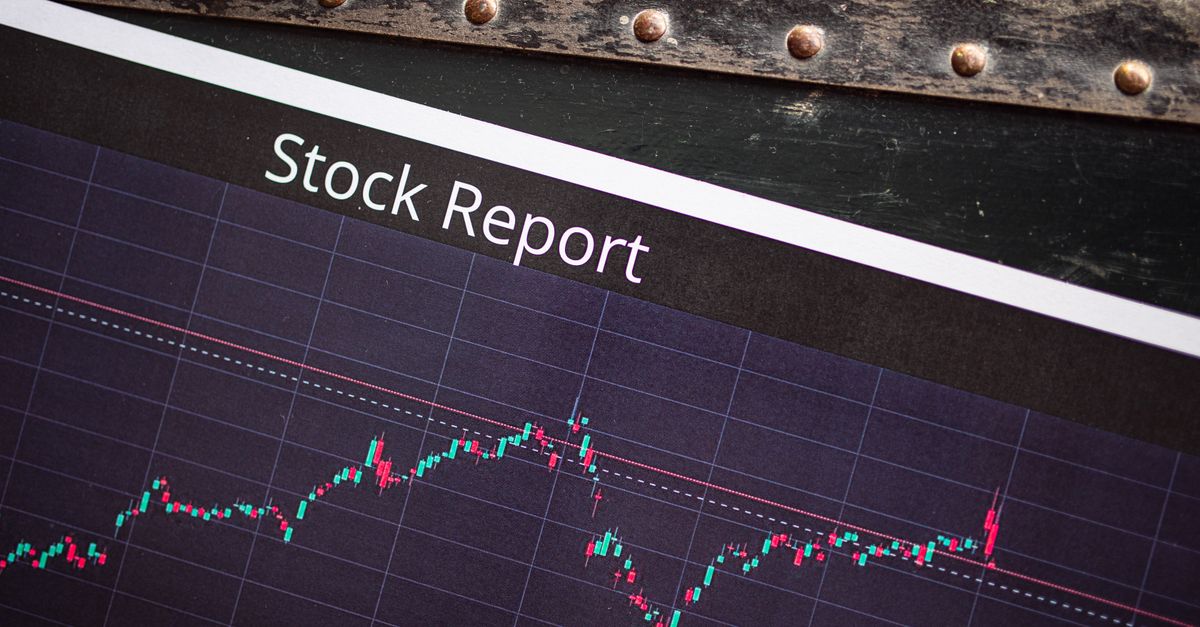
Two of the most widely used confirmation methods for a new trend are trendline breaks and moving average crossovers. A trendline is drawn by connecting at least two significant highs in a downtrend or two significant lows in an uptrend. When price breaks above a descending trendline, it suggests that the previous downward pressure may be fading and buyers are gaining control. Conversely, a break below an ascending trendline suggests that sellers are taking over. Trendlines are simple but subjective; different traders may draw them differently, and a break on one timeframe may not appear on another. Moving average crossovers offer a more mechanical approach. A common system uses a short-term moving average, such as the 10-period or 20-period, and a longer-term moving average, such as the 50-period or 200-period. When the short-term average crosses above the long-term average, it is often called a golden cross and is interpreted as a bullish signal. When it crosses below, it is called a death cross and is interpreted as bearish. The main drawback is lag: moving averages are based on past prices, so crossovers occur after the trend has already started. In choppy markets, they can produce frequent false signals. Traders often combine crossovers with other filters, such as requiring the longer moving average to be sloping in the same direction, or waiting for a pullback to the moving average before entering. Both trendline breaks and moving average crossovers are best used as part of a broader system that includes risk control and market context.